1、引入计算库numpy和绘图库matplotlib:
import numpy as np
import matplotlib.pyplot as plt
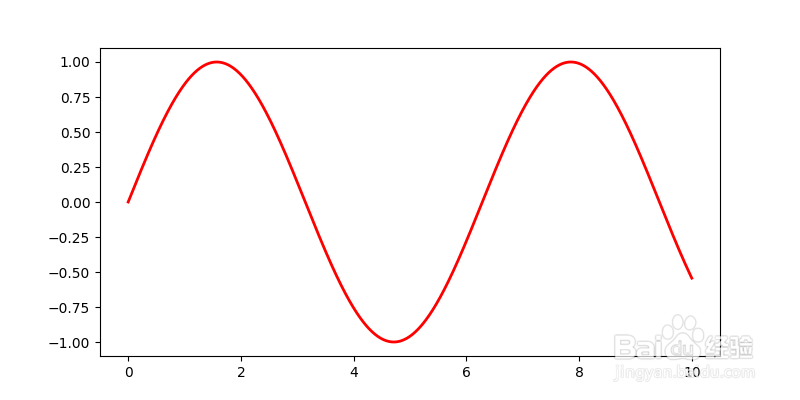
2、创建图像并绘制正弦和余弦函数:
plt.figure(figsize=(8,4))
plt.plot(x,y,label="$sin(x)$",color="red",linewidth=2)
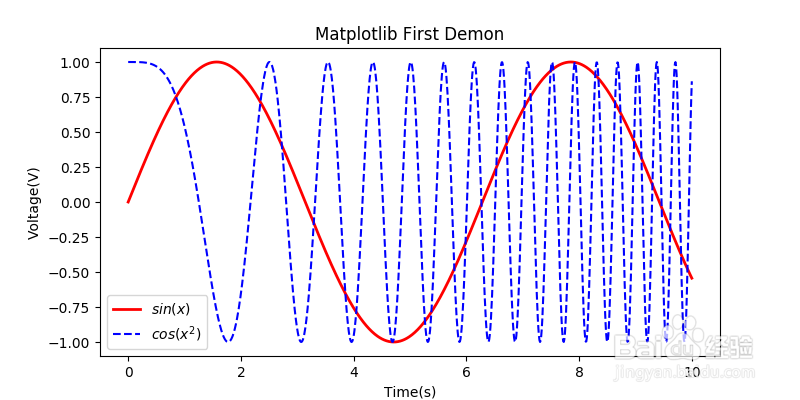
plt.plot(x,z,'b--',label="$cos(x^2)$")
3、设置横轴、纵轴标签,并设置主题(title),最后使用show()函数将图显示出来,也可以实用保存命令将图保存到特定路径:
plt.xlabel("Time(s)")
plt.ylabel("Voltage(V)")
plt.title("Matplotlib First Demon")
plt.legend()
plt.show()
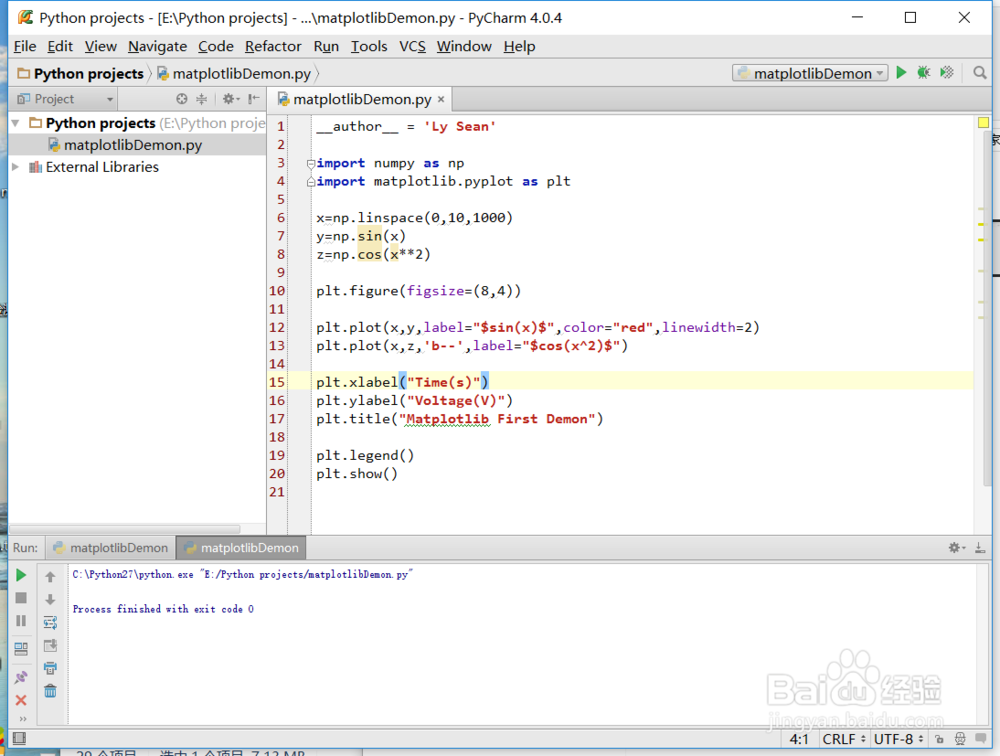
4、全部代码如下:
import numpy as np
import matplotlib.pyplot as plt
x=np.linspace(0,10,1000)
y=np.sin(x)
z=np.cos(x**2)
plt.figure(figsize=(8,4))
plt.plot(x,y,label="$sin(x)$",color="red",linewidth=2)
plt.plot(x,z,'b--',label="$cos(x^2)$")
plt.xlabel("Time(s)")
plt.ylabel("Voltage(V)")
plt.title("Matplotlib First Demon")
plt.legend()
plt.show()